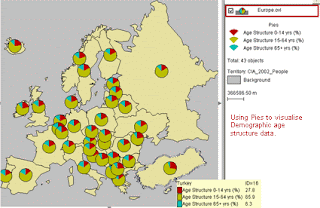
In this proportional circle map of western Europe the circles are divided into percentages displaying the age structures. Proportional circle maps are good maps to use when you have different variables representing different information.
Continuously variable proportional circle map
Tuesday, November 30, 2010
Isopleths
Isopleth maps consist of lines connecting of equal value of distribution for a given theme such as rainfall and temperature. In this photo the acid rain was recorded and distributed on a map of the eastern U.S. The pH levels are represented by color with red being the highest and blue the lowest. Notice that in the Northeast where it is conjested, the pH is higher. Alot of the acid rain is formed in heavily populated areas and where big factories are located.
Isopleth
Isopach
An Isopach map is a map that illustrates the variation of thickness of the rock and soils. This map was used when a person was contructing a well in Venezuela and the isopaches are displayed as red dashes. These types of maps display important information about a given area when drilling or digging out certain land. Also many marine biologist use these maps when studying the tectonic plates under the ocean floor.
Isopach
Isopach
Isohyets
Isohyets are lines drawn on a map that connect to represent equal rainfall. This type of recorded information is useful when researching rainfall in a relatively small area. If I were a farmer buying land I would look at a few graphs that contain Isohyets so I could get a brief background about the history of the rainfall in the area where I was purchasing the the land.
Isotachs
Isotachs are by definition, lines along by which the speed of the wind is consistant. They are usually lines on a consistant elevation or atmospheric pressure. The closer the Isotachs are together, the faster the wind is blowing. The photo above is a pattern that was recorded of the Great Plains.
Isotachs
Isotachs
LIDAR
LIDAR (light detection and ranging) is a type of remote sensing technology that measures properties of scattered light to find information about a distant target. They are said to be very accurate and give plenty more detail than most aerial photos. This is mostly used by scientist and environmentalist, the photo above is a measurement of the tree hight from the forrest floor.
LIDAR
LIDAR
Monday, November 22, 2010
Cartographic Animations
Cartographic Animations displays change in the map through video or computers. The change is shown overtime and is generally used by meteorologist when showing the weather. In this particular map it is showing the animation of the 2004 Indonesian tsunami, it was found at http://en.wikipedia.org/wiki/Animated_mapping
Carographic Animation
Isoline Map
Isoline maps are similar to Isobars. They contain contour lines and can represnent a number of variables. It is usually a two dimensional representation a three dimensional model.
Isoline Map
Proportional Circle Map
Proportional circle maps show information in accordence to the size of the circles in the map. In this proportional circle map the circles represent accidents in certain areas in Europe. The bigger the circles the more the car accidents.
Proportional Circle Map
Dot Distribution Map
Dot distribution maps are very popular and easy to understand. In this dot distribution map above each dot represents 7,500 people. This 2000 census of the U.S. population distribution makes it easy to understand where the dense populations are in the United States. Most of the eastern part is dense while the midwest population is more spead out and picks up along the coast of California.
Dot Distribution Map
Hypsometric Map
Hypsometric maps made from digital elevation models. The pupose of these maps are to portray the land elevation through different colors. Generally the "higher the brighter".
Hypsometric Map
Hypsometric Map
Tuesday, November 2, 2010
Cadastral Map
A cadastral map is a map which provides detailed information about property within a specific area. Some of these maps can contain rights, restrictions and responsibilities. The will also show land ownership and whose in control. Cadastral maps are usually and aerial photograph or drawing of a neighborhood or any other small piece of land.
Cadastral Map
Cadastral Map
Subscribe to:
Posts (Atom)


