A DOQQ is a digital image produced by the USGS. Because they have no scales they are not considered maps just simply an aerial photograph of a givin region. Features are represented in their true ground position, making direct measurement of distance, areas, angles, and positions possible.
DOQQ
Tuesday, October 26, 2010
Tuesday, October 5, 2010
DRG
According to USGS, science for a changing world, a digital raster graphic (DRG) is a scanned image of a U.S. Geological Survey standard series topographic map, including all map collar information. The image inside the map neatline is georeferenced to the surface of the earth and fit to the Universal Transverse Mercator projection. The horizontal positional accuracy and datum of the DRG matches the accuracy and datum of the source map. The map is scanned at a minimum resolution of 250 dots per inch, which is a very high resolution.
Isobars
Isobars is a term mostly used in meteorology. It is defined as a line on a map connecting points of equal atmospheric pressure. Isobars can never cross or touch one another. In the map, meteorologist are able to locate where the high and low pressure areas are in the United States depending on how close the lines are.
Isobars
Isobars
Flow Map
A flow map is defined as "a mix of maps and flow charts, that show the movement of objects from one location to another, such as the number of people in a migration, the amount of goods being traded, or the number of packets in a network. This flow map shows the number foreigners who migrate to America. The thickness of the lines means the most. Asia having the most, and the Caribbean having the least.
Flow Map
Parallel Coordinate Graph
A parallel coordinate graph, according to wikipedia, is a common way of visualizing high-deminsional geometry and analyzing multivariate data. Lines are drawn in the back drop to show the set of points in a deminsional space.
Parallel coordinate graph
Parallel coordinate graph
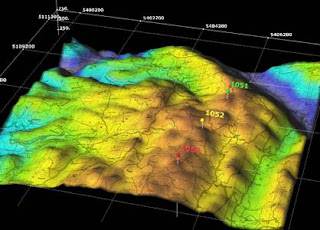
DEM
A DEM, which stands for digital elevation model is a digital representation of a ground surface topography or terrian. They are mainly used for land surveying, geographical information systems, and relief maps. From the map above color indicates the elevation of the land. Brown the highest, blue indicates the lowest.
DEM
Cartogram
A cartogram is a presentation of statistical data in a geographical distribution on a map. There are three types of cartograms that have a very different way of showing attributes of geographic objects- Non-contiguous, Contiguous and Dorling cartograms. In the picture above it distributes the total amphibian population world wide.
Cartogram
Statistical Map

A statistical map gives specific stats of the functional time course over a period of time. It also represents elements pertaining to a theme or interest pertaining to an item, feature, or event.
http://www.neighbourhood.statistics.gov.uk/dissemination/Info.do?page=userguide/detailedguidance/statisticalpresentation/statisticalmaps/best-practice-statistical-maps.htm
Subscribe to:
Posts (Atom)


