Tuesday, August 31, 2010

Population Profile


The graph above shows the number of males and females thorughout the years in the United States and is an example of a population profile. Population profiles can represent anything dealing with population of cities, states, countries, or regions.


Scatterplot


Scatterplots can be used in many ways of presenting data of different variables. Most of the plots consist of two variables with the correlation being positive, negative, or even null. This is a positive because the older the husband, usually older the wife.


Scatterplot

Wednesday, August 25, 2010

Doppler Radar


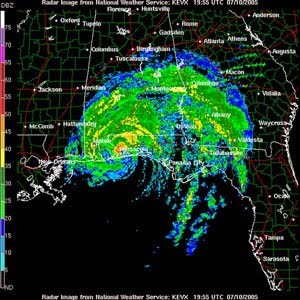
The satillite image a above is an example of a doppler radar, which gets its name from the "Doppler Effect". The Doppler Effect works in a fairly simple way. Satillites are postioned in specific places and send out waves which retrieve the sound of hail, precipitaion, or even dust. The time it takes for the signals that were sent by the satillite to return determain if the weather is moving toward that region or away from it. This is the most reliable tool when it comes to planning for weather.

Source: Doppler Radar

Topographic Map


Topographs are maps that indicate the elevation features of a specific region. Qualitive contrasts are used to illustrate the shape and texture and the picture shown above is an arial shot of the Mountains in Utah. With qualitive contrasts, a person that views this map can clearly see the elevation changes from the gray shaded areas.

Source: Topographic Map

Mental Map


A mental map usually refers to a persons perception of a real life area or location of a region. In the photo above, a mental map is drawn to to give the map reader an idea of his surroundings. These arent not meant to be 100% accurate but just a idea of something real life.


Mental map

Choropleth Map


This Choropleth Map is used to show the percentages of Hispanic or Latino per county in which they live. It is given that this map presents a clear example that the further south you go in Florida, the more the Hispanic/Latino population increases.

Source: Choropleth Map