Tuesday, October 5, 2010
Flow Map
A flow map is defined as "a mix of maps and flow charts, that show the movement of objects from one location to another, such as the number of people in a migration, the amount of goods being traded, or the number of packets in a network. This flow map shows the number foreigners who migrate to America. The thickness of the lines means the most. Asia having the most, and the Caribbean having the least.
Flow Map
Parallel Coordinate Graph
A parallel coordinate graph, according to wikipedia, is a common way of visualizing high-deminsional geometry and analyzing multivariate data. Lines are drawn in the back drop to show the set of points in a deminsional space.
Parallel coordinate graph
Parallel coordinate graph
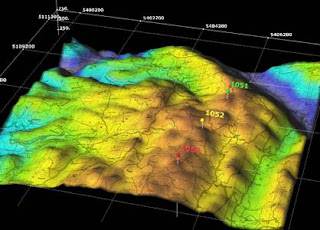
DEM
A DEM, which stands for digital elevation model is a digital representation of a ground surface topography or terrian. They are mainly used for land surveying, geographical information systems, and relief maps. From the map above color indicates the elevation of the land. Brown the highest, blue indicates the lowest.
DEM
Cartogram
A cartogram is a presentation of statistical data in a geographical distribution on a map. There are three types of cartograms that have a very different way of showing attributes of geographic objects- Non-contiguous, Contiguous and Dorling cartograms. In the picture above it distributes the total amphibian population world wide.
Cartogram
Statistical Map

A statistical map gives specific stats of the functional time course over a period of time. It also represents elements pertaining to a theme or interest pertaining to an item, feature, or event.
http://www.neighbourhood.statistics.gov.uk/dissemination/Info.do?page=userguide/detailedguidance/statisticalpresentation/statisticalmaps/best-practice-statistical-maps.htm
Wednesday, September 15, 2010
Thematic Map
Thematic maps are very common. They are defined as a type of map or chart designed to show a particular theme connected with a specific geographic area. These maps can range from social, cultural, political, etc. In the map above, the states are color coated depending on population density by state.
Planimetric Map
Unlike a topographic map, which indicates both horizontal and vertical lines, the planimetric map map only indicates the horzontal lines. This map is useful for when map makers are drawing a map of small areas.
Planimetric Map
Subscribe to:
Posts (Atom)


